The climate

Annual mean temperatures in the headlines for each site refers to annual mean temperatures 1981 – 2010. Source: Norwegian Meteorological Institute, met.no

CLIMATE STATISTICS

The graph (source: Yr.no) shows long-term statistics for yearly temperature and precipitation for the inland Norway.

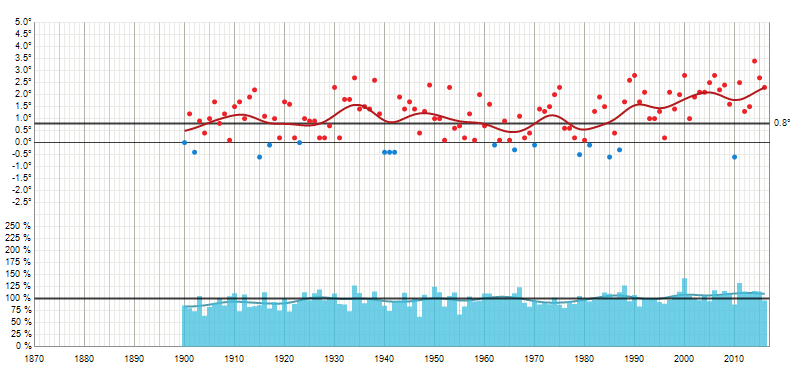
Temperature: The dots indicate average yearly temperature. The line is a 10-year Gaussian distribution. The mean (see explanation above) is drawn as a thick horizontal line.

Precipitation: The blue bars at the bottom of the graph indicate the average yearly precipitation compared to the mean — which is drawn as a thick line through the bars. The line is a 10-year Gaussian distribution.

LAST 12 MONTHS

To see site relevant weather statistics for the last 12 months, please refer to the links in the Climate statistics-section on this page.


Our data center sites

Site: Lalm

Site for power intense activity.

Site: Rudshøgda sør

Easy deforestation, central in the Mjøsa region.

Site: Slomarka

Relativly flat and suited for construction, close to OSL

Site: Plassen

Central, but rural location.

Site: Grundsetmoen

Large site with access to four independent international dark fibers, and with potential for better grid capacity and connectivity. Good opportunities for re-using excess heat!

Site: Krabyskogen

Close to Norwegian University of Science and Technology (NTNU) and one of the largest academic information and cyber security environments in Europe.

Site: Grue Industry Park

Big site on river depositions with good connectivity. Industrial zoning ready for construction.

Site: Heggvin

Big site with potential for power supply up to 200 MW with three different providers of dark fiber.

Site: Åkrestrømmen

Spacious site on a glaciofluvial plain. Power supply up to 100 MW.

Site: Tylldalen

Spacious site. Power supply up to 100 MW.

Flag of Germany Auf Deutsch >